
An Exploratory Automated Analysis of UX Practitioners’ Interviews: Structuring and Visualizing Cognitive Flows
Abstract
Background In-depth interviews have long been recognized as a central method in user experience (UX) and design research, providing access to users’ perceptions, reasoning, and contextualized experiences. Unlike surveys or behavioral data, interviews reveal how users construct meaning, shift perspectives, and integrate emotions into their experiences. However, the analysis of interview data remains labor-intensive and highly dependent on manual coding, often resulting in inconsistencies and limited scalability. Conventional methods such as grounded theory and thematic analysis capture themes and concepts but struggle to structurally represent cognitive transitions over time. Recent advances in natural language processing (NLP), embeddings, and clustering offer new opportunities, yet these methods are mostly optimized for short or semi-structured text. Their application to lengthy, layered interview narratives remains limited. To address these challenges, this study introduces an automated framework that segments interview data into cognitive units and visualizes reasoning flows to support more consistent and scalable qualitative analysis.
Methods We developed a Python-based analytical procedure consisting of four steps: semantic unit segmentation, clustering, cognitive tagging, and visualization. Six cognitive tags were defined: Situational Awareness, Conceptual Clarification, Strategic Application, Reflection & Insight, Perspective Shift, and Constraints & Limitations. A supervised classifier trained in manually labeled utterances automated the tagging process. Visualization tools such as Sankey diagrams and heatmaps were used to illustrate cognitive transitions and centralities. Data collection comprised seven in-depth interviews with UX designers, product managers, and data scientists, resulting in 9.5 hours of recorded material and approximately 110,000 characters of transcribed content.
Results Applying the automated procedure to a total of 1,041 utterances demonstrated that interview data can be quantitatively structured and analyzed along temporal flows and transition patterns. Sankey diagrams and centrality analyses revealed recurring cognitive transitions and key nodes, allowing the structural characteristics of reasoning flows—often difficult to capture through manual coding—to be objectively identified. These findings highlight the potential of analyzing long-form qualitative interviews in a consistent and reproducible manner.
Conclusions This study proposes an automated framework for structurally quantifying and visualizing interview data. Rather than merely classifying types of reasoning, the approach expresses utterance-level transitions and flows through quantitative metrics and visual maps, thereby complementing the subjectivity and limitations of traditional qualitative analysis. Implemented entirely with open-source Python tools, the method can be adopted without advanced technical resources and offers a pathway toward the standardization and scalability of qualitative analysis in UX and design research.
Keywords:
Cognitive Flow Analysis, In-depth Interview Methods, Automated Qualitative Analysis, Structuring and Visualization, UX Research Methodology, Data-drien Design, Data-informed Design1. Introduction
1. 1. Background
In-depth interviews are widely recognized as a foundational method in user experience (UX) and design research, offering a powerful means of exploring users’ experiences, perceptions, and problem-solving strategies. These interviews provide insights into various factors that may exert such influences, including cognitive factors, emotional factors, social factors, and contextual factors.(Henriksen et al., 2025) By capturing internal processes through narrative accounts, in-depth interviews play a particularly critical role in the early stages of user-centered design—especially in framing problems and generating insights.
Whereas survey-based or behavioral methods focus on observable actions or quantifiable outcomes, in-depth interviews allow researchers to examine the underlying meaning-making processes that shape user experiences, essentially to gain detailed insight into participants’ perspectives, emotions, and derived meanings (Rutledge & Hogg, 2023). These methods provide access to users’ cognitive reasoning, emotional progression, and contextual interpretation—elements often inaccessible through standardized instruments or behavioral tracking alone.
Despite their value, the analysis of interview data remains heavily reliant on manual interpretation. Jiang et al. (2021) noted that such processes are inherently manual and human-resource-intensive, which makes them often infeasible for analyzing large corpora. Qualitative approaches, such as grounded theory and thematic analysis, are commonly used to code and organize user utterances. However, these techniques are labor-intensive, time-consuming, and susceptible to inconsistencies due to individual analysts’ subjective judgments, a challenge also noted in prior work that highlighted the risks of relying on manual coding (Namey, Guest, Thairu, & Johnson, 2008). Furthermore, user narratives frequently unfold as temporally sequenced cognitive flows, making it difficult to structurally capture transitions and developmental changes over time using traditional methods.
To address these limitations, recent studies have applied natural language processing (NLP), sentence embedding, and clustering techniques to structure qualitative data. These computational approaches have demonstrated potential, particularly in analyzing short-form, unstructured texts such as online reviews and social media posts. However, their effectiveness remains limited when applied to in-depth interviews, which often involve longer and more complex utterances that reflect layered cognitive processes. Parfenova (2024) highlights that traditional qualitative coding is highly labor-intensive, underscoring a substantial demand for tools that can better support and automate the analysis process.
Notably, limited efforts have been made to segment such data into analyzable cognitive units or to establish repeatable automated procedures for design practitioners.
1. 2. Research Objective
This study proposes an automated procedure for the structural and quantitative analysis of in-depth interview data and explores its applicability within UX research contexts. The procedure segments interview transcripts into semantic units and applies a series of analytical processes—developed and executed in Python—to identify and visualize patterns in cognitive flow. A supervised classification model trained on manually tagged utterances is integrated with supplementary interpretation using a large language model (LLM). This combination enables the automatic detection of cognitive transitions and the visualization of recurring reasoning structures and dominant pathways.
Rather than focusing solely on the semantic content of user narratives, the proposed procedure adopts a structural, data-informed perspective to examine how user cognition unfolds over time. It transforms qualitative utterances into repeatable, analyzable units while preserving the narrative depth and contextual richness of the original data.
Ultimately, this study introduces a practical and accessible analysis framework that does not rely on proprietary tools or advanced AI infrastructure. By leveraging widely available open-source Python libraries, the procedure empowers UX researchers and designers to independently structure and interpret qualitative data. In doing so, the study aims to improve the consistency and repeatability of qualitative analysis while promoting the integration of structured, data-supported reasoning into UX research practice.
2. Theoretical Background and Related Work
2. 1. The Role of In-depth Interviews in Design Research
In-depth interviews are widely regarded as a foundational method in UX and design research, particularly for investigating users’ experiences and cognitive processes. As McCarthy and Wright (2004) argue, qualitative accounts such as interviews allow researchers to explore not only what users do, but also how they make sense of and emotionally engage with their experiences. This method plays a critical role in the early stages of user research, where problem framing and contextual understanding are essential. Unlike structured questionnaires, in-depth interviews encourage participants to recount their experiences as they naturally unfolded. This approach enables researchers to gain insights into users’ reasoning, emotional dynamics, and the contextual factors that shape their perceptions.
The narrative structure of in-depth interviews allows for a deeper understanding of user behavior by revealing internal thoughts and emotions rather than relying solely on observable actions or quantifiable outcomes. In this way, in-depth interviews support experience-centered design practices by providing a means to explore the underlying mechanisms that influence user behavior (Nielsen Norman Group, 2017).
A key strength of in-depth interviews lies in their open-ended, participant-driven format. Instead of following rigid question structures, this method invites participants to construct their own narratives, which helps uncover individual sense-making processes. This characteristic makes in-depth interviews particularly effective for collecting narrative data that reflect how users interpret and frame their experiences (Kvale, 1996; Cohen et al., 2007).
Through participant-driven articulation, in-depth interviews yield insights that are often difficult to obtain through observational or quantitative methods. The richness of narrative data allows researchers to develop more nuanced and contextually grounded interpretations, thereby reducing the risk of oversimplified conclusions about user behavior (Berg, 2007; Hamza, 2014).
Overall, in-depth interviews serve not only as a method of data collection, but also as a lens for examining how users construct meaning, shift perspectives, and respond emotionally within design contexts. Their ability to reveal temporally sequenced and layered cognitive-emotional processes makes them particularly valuable in research settings that demand a comprehensive understanding of user-centered thinking.
2. 2. Interview Analysis Methods and Their Constraints
In-depth interviews are a widely used qualitative method for capturing the narrative structure of user experiences. Their analysis typically relies on interpretive approaches that examine how participants construct meaning within context. In design research, where user-centered perspectives are emphasized, qualitative analysis methods are often adopted for their capacity to explore users’ reasoning and decision-making processes in depth.
Two representative approaches include grounded theory and thematic analysis. Grounded theory is an inductive method for generating concepts from raw data, such as interview transcripts, through a structured sequence of open, axial, and selective coding (Glaser & Strauss, 1967). Thematic analysis, by contrast, is a flexible technique that can be applied without a predefined theoretical framework. It identifies recurring meanings and patterns across participant narratives to construct themes and interpret phenomena. (Braun & Clarke, 2006)

Two Representative Interview Analysis Methods and Their Focus
Other auxiliary methods include protocol analysis and affinity diagramming. Protocol analysis sequences utterances chronologically to examine cognitive flow, while affinity diagramming segments utterances into meaning units and visually clusters them. These tools assist in organizing narrative data and extracting key topics; however, they remain limited in reconstructing the more intricate structures that often characterize user interviews.
Despite their methodological value, these approaches share common limitations when applied to in-depth interview data, which often exhibit frequent transitions and layered narratives. Grounded theory supports the organization of conceptual relationships but is frequently criticized for inviting interpretive subjectivity during iterative coding, potentially compromising analytic consistency (Thomas, 2006). Thematic analysis is valued for its accessibility, yet its lack of clearly defined thematic criteria can reduce reliability and overlook subtle contextual shifts in meaning (Braun & Clarke, 2006).
Affinity diagramming supports the visual organization of qualitative data but may lead to inconsistent outcomes due to subjective grouping standards among researchers (Hanington & Martin, 2012). Protocol analysis is effective for tracing temporal sequences of thought but lacks the structural depth to fully capture semantic transitions or shifts in reasoning over time (Ericsson & Simon, 1993).
In sum, while these methods offer useful frameworks for extracting themes and concepts, they remain limited in their ability to structurally represent the temporal logic, shifts in judgment, and contextual linkages embedded in in-depth user narratives. Given the layered reasoning and cognitive complexity involved, there is increasing recognition of the need for complementary analytical approaches that enable more precise and systematic interpretations of such data.
2. 3. Trends in the Automated Analysis of Qualitative Data
While the qualitative analysis methods discussed earlier support in-depth interpretation, they present notable limitations when applied to complex narrative data, such as in-depth interviews—particularly regarding scalability, interpretive consistency, and analytical reproducibility. To address these challenges, recent studies have increasingly explored methods to quantify, automate, structure, and visualize narrative-based qualitative data. These efforts aim to overcome the inherent drawbacks of manual approaches, including the time-intensive nature of coding, the influence of researcher subjectivity, and the difficulty of ensuring consistent replication.
Among the emerging techniques, clustering, and embedding have been widely applied to text data to identify latent structures and recurring patterns. These computational approaches help minimize subjective interpretation while improving the scalability of large-scale qualitative analysis. However, most existing methods are optimized for short-form content, such as social media posts or micro-level discourse, limiting their applicability to longer, more complex formats like in-depth interview transcripts. An overview of representative studies employing these techniques is provided in Table 2.
Summary of Representative Studies on the Automated Analysis of Qualitative Text Data
Following the overview of current approaches (see Table 2), this landscape underscores the growing need for methodologies that can more precisely structure and analyze interview-based qualitative data.
For instance, Petukhova et al. (2024) examined relatively structured textual sources—such as news articles and academic keywords—using a combination of large language model (LLM) embeddings, including OpenAI’s text-embedding-ada-002, BERT, and Falcon, alongside clustering algorithms, such as K-means, agglomerative hierarchical clustering (AHC), and fuzzy C-means. Their findings demonstrated that clustering performance varied depending on the specific embedding–clustering combination, thereby empirically validating the feasibility of structuring unstructured text using these techniques.
Comparable efforts have emerged in domestic research. Min and Lee (2023) applied LDA topic modeling to YouTube comment data, quantitatively extracting user insights relevant to the early stages of design research. Yoon et al. (2022) conducted a multi-layered structural analysis by integrating expert interview data with online utterances related to metaverse platforms. Similarly, Park (2020) employed TEXTOM to analyze and visualize social media content from 54 global design firms, demonstrating the structural interpretability and expressive potential of qualitative textual data.
While these studies have primarily focused on short-form, semi-structured texts, they demonstrate the potential for automated analysis of qualitative data using embedding and clustering techniques. However, applying these techniques to in-depth interview data remains challenging due to the richness of user narratives, extended sentence lengths, and the inherent complexity of meaning progression. In particular, existing approaches fall short in capturing and visualizing the temporal and semantic shifts embedded within narrative sequences—underscoring the need for more advanced analytical frameworks and interpretive strategies tailored to the unique structure of in-depth interview data.
3. Research Procedure and Analytical Framework
3. 1. Research Method
This study aimed to structure in-depth interview data into a format suitable for quantitative analysis and to design an automated procedure that supports the visual interpretation of cognitive flow. Specifically, a Python-based framework was developed to transform qualitative data into analyzable structures and to visualize the progression and transitions of utterances. This approach was designed to address the limitations commonly associated with traditional qualitative methods—such as repetitiveness and limited scalability—while enhancing both analytical efficiency and interpretive consistency.
The research followed a conceptual sequence (see Figure 1) operationalized into four concrete steps: (1) semantic unit segmentation, (2) utterance clustering, (3) tagging of composite cognitive flows, and (4) visualization and structural interpretation. The labels in Figure 1 represent abstract phases, while the terminology used in the main text reflects the actual implementation of the research process.
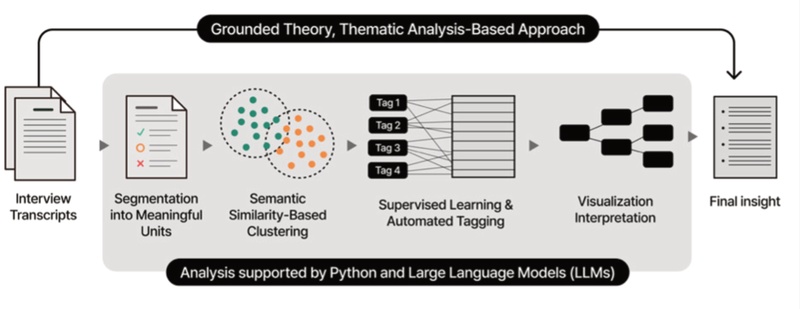
From Intuitive Interpretation to Structured Automation: A Comparative Framework for Interview Data Analysis
Among these steps, segmentation, and clustering function as foundational operations applicable to a broad range of textual data; therefore, their relative importance in this study is limited. Semantic unit segmentation is essential for analyzing the progression of interview responses, but may be unnecessary for short-form or non-narrative texts.
In contrast, tagging, and visualization constitute the core components of the proposed method. The tagging step does not focus on thematic labeling; instead, it identifies shifts in cognitive intention and meaning within utterances. The visualization step transforms the tagged data into structured, time-series representations that enable comparative analysis across users and clusters.
Step 1: Semantic Unit Segmentation
To divide interview responses into cognitively meaningful segments rather than full sentences, an initial segmentation draft was generated using a Python script. This output was manually reviewed and revised to ensure contextual and logical coherence. The resulting structured units served as the foundation for subsequent clustering and tagging, enabling the experimental validation of cognitive unit-based structuring.
Step 2: Utterance Clustering
The segmented utterances were embedded using sentence-level embeddings, and clustering was conducted based on semantic similarity. The optimal number of clusters was determined using the silhouette score. To verify the thematic validity of each cluster, keywords were extracted using term frequency-inverse document frequency (TF-IDF) analysis. This process facilitated the identification of overarching patterns in users’ cognitive trajectories.
Step 3: Tagging of Composite Cognitive Flows
Each utterance was analyzed in terms of its internal narrative structure and cognitive development. Up to four sequential tags were assigned to represent shifts in cognitive intention. Six tags were defined: Situational Awareness, Conceptual Clarification, Strategic Application, Reflection & Insight, Perspective Shift, and Constraints & Limitations. These tags were derived through a combination of qualitative interpretation and large language model (LLM)-assisted pattern recognition. A subset of utterances was manually annotated and used to train a classifier, which was then applied to the full dataset for automated tagging.
Step 4: Visualization and Structural Interpretation
The final step involved visualizing and interpreting the clustered and tagged results. Sankey diagrams were used to analyze the transition structures between cognitive states. Additionally, heatmaps, slope graphs, and radial plots served as supplementary tools for examining co-occurrence patterns, centrality distributions, and cognitive structure differences across clusters.
These procedures were implemented using Python libraries, such as pandas, scikit-learn, Plotly, and Seaborn. The framework experimentally validated the feasibility of transforming qualitative interview narratives into repeatable, analyzable units—thereby supporting scalable and structured interpretation of complex cognitive data.
3. 2. Interview Planning and Data Collection
The interview phase was initially designed to explore how data-informed design is implemented within real-world workflows. The original objective was to examine designers’ approaches to problem framing, data interpretation, and cross-functional collaboration, thereby offering insight into the practical execution of data-driven design.
However, during the interview process, it became apparent that participants’ utterances were not merely descriptive accounts of past experiences; instead, they exhibited temporally sequenced reasoning patterns and recurring cognitive structures. This observation prompted a shift in the research focus towards the structural potential of qualitative data. As a result, the interview transcripts were reinterpreted as experimental material for developing and validating an automated analysis method capable of structurally mapping and visualizing thought progression.
The interview protocol was organized around three thematic domains. First, to understand how data influences the problem definition stage, participants were asked about their access to data, available tools, and team collaboration structures. Second, challenges in data interpretation were explored, including inter-role differences in data literacy and the tension between quantitative and qualitative evidence. Third, collaboration between design and data teams was examined with attention to organizational constraints and institutional supports that enable designers to work effectively with data.
A total of seven one-on-one, in-person interviews were conducted with UX/UI designers, product managers (PMs), and data scientists. All participants had more than three years of professional experience and had worked on data-driven design projects. Their domains included mobile commerce, healthcare platforms, content, search services, and B2B solutions, providing a diverse foundation for analyzing data practices across various operational contexts.
Participants’ Data-Related Design Work
A semi-structured interview format was adopted to allow flexible adjustment of the sequence and depth of questions based on participants’ responses. This flexibility enabled the natural emergence of cognitive progressions. Each interview lasted approximately 80 minutes, resulting in a total of 9.5 hours of audio recordings. The recordings were transcribed into textual data, yielding approximately 110,000 characters (including spaces).
The transcripts revealed that designers’ cognitive approaches to data utilization unfolded in a structured and sequential manner. Notably, cognitive transitions within and across utterances exhibited recurring patterns, suggesting that qualitative data can be treated as structurally analyzable material rather than as purely impressionistic accounts.
Building on this potential, the research developed a methodology to automate the structuring and visualization of interview data. The analysis focused on capturing sequential and relational meaning transitions within utterances, with the goal of enabling scalable reuse in future qualitative research.
3. 3. Semantic Unit Segmentation and Preprocessing
To convert interview data into an analyzable format, utterances were segmented based not on grammatical sentences but on semantic units—discrete segments reflecting changes in cognitive flow and logical development. Although sentence-based analysis is common in qualitative research, it often falls short of capturing the continuity and structure of reasoning, particularly when cognitive transitions span multiple sentences. Therefore, this study adopted semantic units as the minimal unit of analysis to more precisely represent the participants’ thought processes.
Semantic units were defined as interpretation-centered components that signify shifts in reasoning or rhetorical structure. These segments are not merely smaller subdivisions of sentences; rather, they serve as foundational building blocks for analyzing the development of cognition and logic within narrative responses. Segmentation was guided by the presence of cognitive transitions, shifts in emphasis, and discourse markers.
The segmentation process was implemented in two stages. First, the interview transcripts were tokenized at the sentence level using Python’s NLTK library. Next, a rule-based algorithm developed by the researcher restructured the data into semantic units. This algorithm utilized discourse cues, such as conjunctions, to determine whether to segment or merge clauses. For example, adversative expressions like but, however, and on the other hand served as segmentation triggers, whereas connective expressions such as so, and, and demonstrative phrases like this situation or that approach functioned as merging indicators to preserve context. Table 4 presents representative examples of segmentation rules.
Segmentation and Merging Rules for Semantic Units
To prevent demonstratives such as this or that from standing alone without referential context, the algorithm merged these utterances with their preceding segments. After the initial segmentation, a length-based rule (minimum length = six words) was applied to avoid excessively fragmented segments. Subsequently, the researcher manually reviewed and revised a total of 45 segments to ensure logical coherence and preserve causal relationships within the cognitive flow (see Table 5).
Example of Segmentation andMerging Applied to Interview Transcripts
These restructured semantic units formed the basis for all subsequent stages, including cognitive tagging, classifier training, clustering, and visualization. To assess the stability of preprocessing, we compared the number of original sentences to the number of generated semantic units and calculated the segmentation loss rate. The loss rate was negligible, indicating minimal information loss during restructuring.
This preprocessing pipeline was essential for preparing the data for structural and automated analysis, providing a reliable foundation for scalable interpretation of qualitative narratives.
3. 4. Utterance Clustering for Cognitive Pattern Structuring
After preprocessing the utterances into semantic units, each unit was transformed into a high-dimensional semantic vector using sentence embedding. Dimensionality reduction was then applied using Principal Component Analysis (PCA) and Uniform Manifold Approximation and Projection (UMAP) to visualize the clustering structure in two-dimensional space. This procedure served as an exploratory step to examine semantic similarities among utterances and determine whether natural clusters emerged.
PCA simplifies the overall structure by identifying axes of high variance in the vector space, which is useful for confirming the global distribution of data. In contrast, UMAP preserves local semantic similarities between utterances more effectively, facilitating the visual identification of cluster boundaries. Considering the complementary strengths of these techniques, this study employed both: PCA was used to normalize the overall embedding space, while UMAP enabled an intuitive assessment of cluster separability.
Cosine similarity between utterances was calculated to evaluate semantic closeness. The results indicated a tendency toward forming two major clusters. The silhouette score peaked at 0.5008 when the number of clusters was set to K = 2, and the cosine distance between the two cluster centroids reached 2.000, confirming the semantic distinctiveness of the groups. Based on these findings, the number of clusters was finalized at two (see Figure 2).
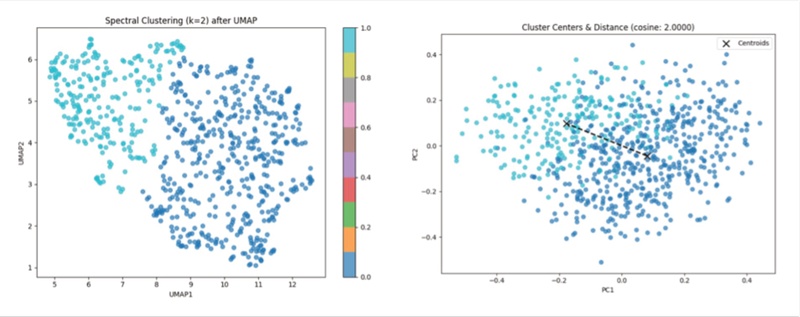
Clustering Structure Visualization Using UMAP and PCA: Spectral Clustering Results and Inter-Centroid Relations
To automatically classify each utterance into one of the two clusters, a supervised binary classification model was developed. Ten utterances were randomly selected from each cluster and manually labeled, creating a training dataset of 20 samples. Using this dataset, a logistic regression model was trained and then applied to the full set of utterances. Approximately 60 utterances with confidence scores below 0.6 were manually reviewed and relabeled as necessary. As a result, 550 utterances were assigned to Cluster 0, and 491 to Cluster 1, producing a final dataset of 1,041 utterances for analysis
To indirectly validate the semantic separation achieved by the automated classification model, a comparative analysis of representative keywords across the two clusters was conducted using term frequency–inverse document frequency (TF-IDF). Cluster 0 featured high-ranking keywords, such as user, problem, context, and coordination, indicating an emphasis on problem framing, strategic planning, and cross-functional negotiation. In contrast, Cluster 1 was characterized by keywords including figures, data, and at this stage, suggesting a stronger focus on decision-making grounded in executional data (see Table 6).
Comparison of TF-IDF Keywords and Utterances by Cluster
These clustering results illustrate that cognitive structures and data usage strategies can be clearly distinguished based on utterance type. The classification served as a foundational framework for subsequent tagging-based flow analysis and visualization. In particular, the clustering process demonstrated the feasibility of systematically interpreting qualitative designer interviews in a repeatable manner, highlighting its value as an analytical procedure for structuring and differentiating cognitive approaches.
3. 5. Categorization Framework and Automated Analysis
Following the clustering of utterances into two distinct types, the study aimed to identify the cognitive flow embedded within each cluster. To achieve this, categorization criteria were developed to reflect the semantic structure of utterances, encompassing their communicative purpose, cognitive development, and decision-making logic. Emphasis was placed on both interpretability and applicability. Based on these criteria, composite tagging was performed by sequentially assigning tags to each transition point within the utterance, allowing the internal cognitive structure to unfold incrementally. This tagging method served as a practical analytical approach for structurally organizing qualitative utterances through automated tagging.
The categorization criteria were derived by combining the researcher’s qualitative interpretations with suggestions from GPT-4 (OpenAI). For each sample utterance, both the researcher and the language model independently proposed tag labels. When interpretations aligned, the shared label was adopted. In cases of discrepancy, the researcher’s categorization was prioritized, considering contextual coherence and interpretive reliability. This dual approach ensured a balance between semantic diversity and classification consistency (see Table 7).
Comparison of GPT-4 and Researcher Labeling for Utterance Classification
As a result, six final tag categories were confirmed. Their formal definitions and corresponding examples are detailed in Table 8.
Final Tag Definitions and Corresponding Utterance Examples
These classification criteria enabled systematic analysis of the semantic progression within utterances and provided the foundation for subsequent structural comparisons of reasoning patterns. A total of 60 utterances—30 from each cluster—were manually tagged to form the training dataset. Selection criteria included utterance length, logical complexity, and semantic flow. Brief, single-purpose utterances received one tag, whereas more cognitively complex utterances were assigned up to four sequential tags. Although sentence length served as a supplementary guideline, the final number of tags was determined by the internal structure and progression of thought.
Using these manually labeled samples, the model was trained for automatic tagging. Each utterance was embedded as a vector using the pre-trained KoSBERT model (jhgan/ko-sbert-nli), which is optimized to capture semantic similarity in Korean sentences. The classification system employed a one-vs-rest architecture, training independent binary classifiers for each tag. Logistic regression was selected for its interpretability and learning efficiency.
In addition to sentence embeddings, normalized utterance length was included as an input feature to dynamically adjust the number of predicted tags per utterance. The system allowed assignment of up to four tags per utterance. Approximately 57 utterances with confidence scores below 0.6 were manually reviewed and corrected to ensure tagging accuracy. (see Table 9)
Examples of Composite Tag Assignments
Following this process, composite tagging was applied to the entire dataset of utterances. The distribution of tags is summarized in Table 10. Approximately 65% of all utterances received two or more tags. Among the six categories, Strategic Application, Reflection & Insight, and Situational Awareness appeared most frequently. This distribution indicates that practicing designers tend to prioritize execution strategies, reflective reasoning, and contextual judgment as core modes of thinking in data-driven decision-making processes.
Tag-Wise Frequency and Representative Utterances
Finally, based on the automated tagging results, the internal cognitive flow and transitional structures within utterances were visualized. These visualizations facilitated the comparison and analysis of structural differences in thinking patterns across clusters. This approach transcends simple frequency counts, providing a foundation for transforming qualitative data into structured insights. It enables a more nuanced interpretation of transitional contexts and intercategory relationships within design cognition.
3. 6. Visualization of Utterance Flow
Following the structuring of qualitative utterance data, an automated visualization procedure was developed to systematically interpret patterns of cognitive progression. The primary goal was to visualize utterance structures based on automatically assigned cognitive function tags, thereby quantitatively capturing the directionality and transition dynamics of thought processes. This approach addresses the inherent subjectivity and limited reproducibility of conventional qualitative analysis, aiming to establish a repeatable and scalable analytical framework.
A key visualization tool employed was the Sankey diagram, which depicts directional transitions and frequency-based flows between cognitive functions within utterances. This diagram aggregates transition patterns observed across individual utterance flows, providing a visual foundation for comparing cognitive structures and recurring patterns between clusters. By illustrating both the direction and intensity of function-to-function transitions, the Sankey diagram facilitates intuitive recognition of structural features in cognitive flows.
To provide a more multidimensional interpretation of cognitive structures, complementary visualization techniques were employed. A heatmap was used to analyze co-occurrence patterns of cognitive functions, quantifying the density and concentration of thought patterns within each cluster. A slope graph facilitated the comparison of relative shifts in function centrality across clusters. Additionally, a radial plot visualized the overall distribution of functions per cluster, enabling observers to quickly assess the spread and focus of cognitive activity. A divergence bar chart evaluated the relative emphasis on cognitive structures by statistically comparing function centrality scores between clusters.
This multi-visualization approach constitutes an integrated analytical framework that enables a multifaceted examination of transition structures, recurrent pathways, centrality, and functional combinations. By automating data processing and visualization, the pipeline minimizes interpretive bias and fosters more consistent structuring of qualitative data. Ultimately, this enhances the objectivity and analytical rigor of qualitative research, demonstrating the practical potential of this method as a robust analytical tool within the field of UX research.
4. Results and Structural Validity of the Automated Analysis Framework
4. 1. Visualization Results and Structural Validity
This study applied the proposed automated visualization analysis procedure to a total of 1,041 qualitative interview utterances in an exploratory manner. The results demonstrated the potential to quantitatively identify and visualize the structural characteristics of cognitive flow that are challenging to capture through conventional manual analysis. After segmenting utterances into semantic units, sequential transitions between cognitive tags within each utterance were extracted and visualized using Sankey diagrams. This visualization enabled an intuitive representation of flow direction and transition frequency. Specifically, the saturation of each connection line was weighted by transition frequency, with connections exceeding a threshold of 0.6 highlighted in darker tones to emphasize dominant cognitive pathways.
The integration of similarity-based clustering and automated tagging yielded two distinct clusters reflecting different characteristics of cognitive progression. These clusters were differentiated by their points of initiation, transition patterns, and core tag networks. Accordingly, Cluster 0 was labeled as Interpretation-Driven Cognition, while Cluster 1 was labeled Execution-First Cognition.
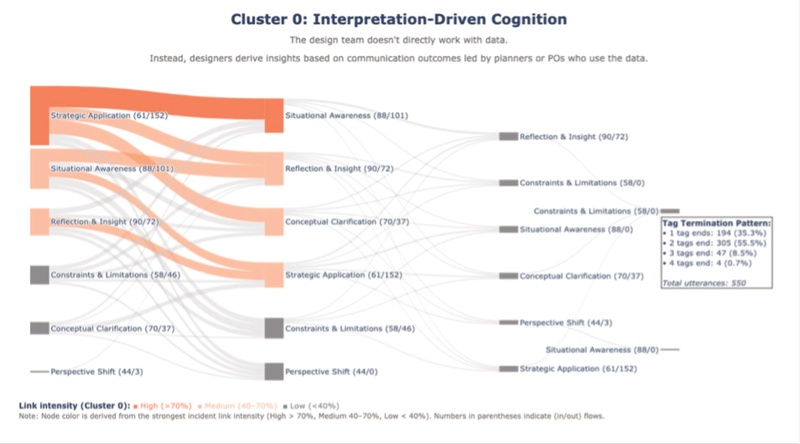
Sankey Diagram of Cluster 0: Interpretation-Driven Cognition
In the Interpretation-Driven Cognition cluster, the most frequent transition was from Strategic Application to Situational Awareness (53 instances), visualized with a dark orange line to emphasize the central role of strategy-oriented thinking at the onset of cognitive flow. Other prominent transitions included Situational Awareness → Reflection & Insight (36 instances) and Strategic Application → Conceptual Clarification (36 instances), indicating a recurring pattern of cognitive preparation for interpretation. For example, utterances such as “Designers don’t directly handle data, so they derive insights based on communication outcomes shared by planners or POs” illustrate a typical cognitive progression: moving from strategic context to situational interpretation, conceptual clarification, and reflective insight. Strategic Application thus appeared as a major starting point in the flow (see Table 11), but in terms of structural centrality, Conceptual Clarification emerged as a more influential tag.
Representative transition counts with Sankey in/out values (example table)
Based on this observation, the centrality analysis revealed that while Strategic Application often initiated the flow, Conceptual Clarification served as the most influential hub within this cluster, with a centrality score of 213—accounting for 25.9% of the total (see Table 12). This prominence was visually represented in the Sankey diagram by its thicker orange connections, clearly indicating its role as the core axis of cognitive progression in interpretation-driven cognition.
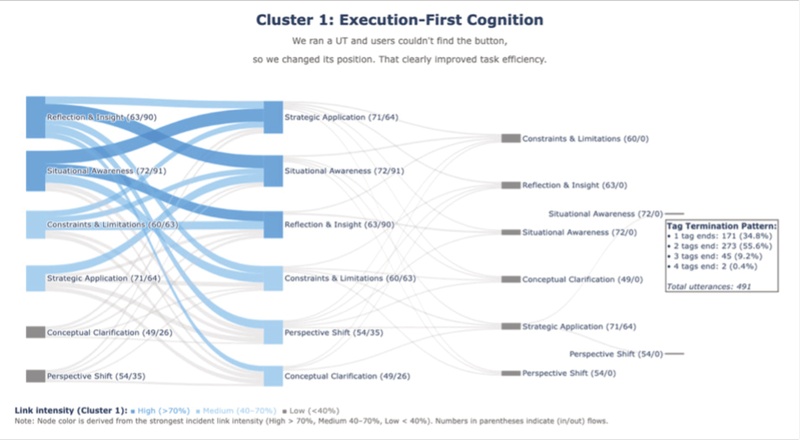
Sankey Diagram of Cluster 1: Execution-First Cognition
Centrality Scores and Proportions by Tag in Each Cognitive Type
Conversely, in the Execution-First Cognition cluster, transitions centered on lived executional experiences. The most prominent pathway was Reflection & Insight → Situational Awareness (30 instances), followed by Situational Awareness → Strategic Application (27 instances) and Situational Awareness → Constraints & Limitations (22 instances). These transitions were visualized with dark blue connection lines, highlighting the strong cognitive flow from reflection to situational recognition and strategic response. Utterances such as “When we ran the usability test, users struggled to find the button, so we changed its position—and it clearly improved task efficiency” exemplify this typical flow, beginning with reflection, progressing through situational awareness, and culminating in a revised strategy.
In terms of centrality scores, Situational Awareness emerged as the dominant hub within this cluster, scoring 163 and accounting for 22.1% of the total (see Table 12), based on centrality analysis rather than only visual thickness. This was reflected in the Sankey diagram through its stronger blue connections, visually reinforcing that execution-based cognition is centrally oriented around recognizing and responding to contextual conditions.
To gain deeper insight into the structural patterns of cognitive transitions, a centrality analysis was conducted. In the interpretation-driven cluster, Conceptual Clarification exhibited the highest centrality score (213, 25.9%), followed by Situational Awareness (23.0%) and Reflection & Insight (19.7%). In contrast, in the execution-first cluster, Situational Awareness led with a score of 163 (22.1%), followed by Reflection & Insight (20.7%) and Conceptual Clarification (18.3%). These results are consistent with the earlier findings, indicating that the hubs identified in the transition flow also align with structural centrality. This comparative analysis of connection centrality quantitatively assessed the relative significance of key tags in each cluster. Unlike previous approaches that relied heavily on subjective interpretation, this method enabled structural differentiation to be measured with greater objectivity and precision.
The results of the centrality analysis revealed that identical tags may assume markedly different roles depending on the type of cognitive f low (see Table 12). For instance, Conceptual Clarification held the highest centrality in interpretation-driven cognition at 25.9%, whereas its centrality decreased to 18.3% in execution-first cognition. Conversely, Perspective Shift accounted for only 5.7% of centrality in interpretation-driven cognition but rose to 12.1% in execution-first cognition—more than doubling its relative importance. These findings suggest that centrality scores offer insights beyond mere frequency counts, elucidating the strategic positioning of each tag within the overall cognitive structure.
These findings suggest that centrality scores offer insights beyond mere frequency counts, elucidating the strategic positioning of each tag within the overall cognitive structure. Moreover, the results underscore the value of quantitative, automated analysis in revealing structural differences that are challenging to detect through manual interpretation alone. Notably, Conceptual Clarification emerged as the central hub within the interpretation-driven cognition cluster, with a centrality share of 25.9%. In contrast, Situational Awareness was the most central tag in the execution-first cognition cluster, accounting for 22.1%. This indicates that in execution-oriented reasoning, contextual awareness serves as the anchor for cognitive progression.
Taken together, these findings demonstrate the effectiveness of combining Sankey diagram visualization with centrality analysis as a robust method for quantitatively comparing and interpreting differences in cognitive flow structures. This approach provides a rigorous foundation for understanding how identical cognitive tags function differently depending on their position within the reasoning process. Moreover, by minimizing interpretive bias and facilitating consistent analysis of large-scale qualitative data, this automated visualization technique reinforces the empirical validity of qualitative research. In particular, its capacity to visually map the recurrence and prominence of tag transitions enables researchers to reveal cognitive flow patterns that might otherwise remain hidden in traditional manual analysis.
4. 2. Supplementary Visual Analyses for Structural Comparison
While the Sankey diagram effectively illustrated the sequential progression of cognitive flow tags within individual utterances, additional visualization methods were employed to more precisely interpret the multidimensional characteristics of cognitive structures and their quantitative differences across clusters. This multilayered approach addresses the limitations of relying on a single visualization technique by highlighting variations in density, distribution, and centrality within cognitive flows.
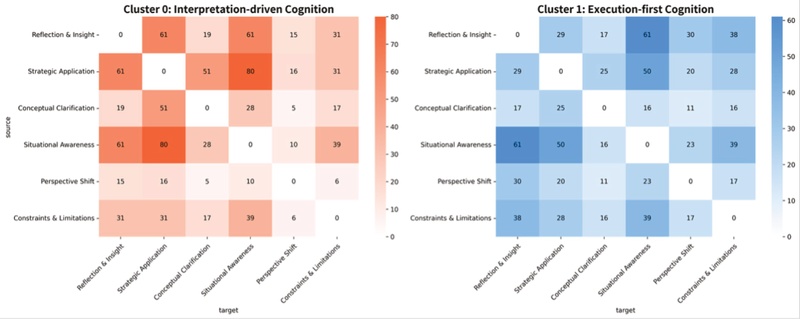
Cluster-wise Heatmap of Cognitive Tag Co-occurrence Patterns
Heatmap analysis, for example, identified co-occurrence frequencies between cognitive flow tags, revealing distinct combinational patterns across clusters. In the interpretation-driven cognition cluster, the pair Strategic Application – Conceptual Clarification frequently occurred. In contrast, the Execution-First Cognition cluster was dominated by the pairing Situational Awareness – Constraints & Limitations. This visual depiction of tag co-occurrence within utterances aids in quantifying the cohesion and convergence tendencies of underlying cognitive structures.
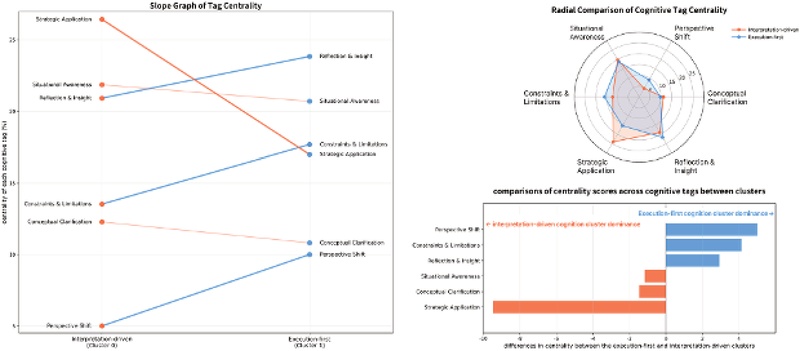
Multimodal Visualization of Cognitive Tag Centrality Differences Between Clusters
The slope graph was employed to track changes in the centrality of each cognitive tag between clusters. For example, Strategic Application exhibited the highest centrality in the interpretation-driven cluster but showed a marked decline in the execution-first cluster. Conversely, Perspective Shift demonstrated a pronounced increase in centrality within the execution-first cognition type. These shifts in centrality offer valuable insights into how cognitive structures are strategically organized and prioritized within each cluster. It should be noted, however, that while the slope graph places Strategic Application at the upper end of the Interpretation-driven cognition, the exact centrality scores in Table 12 indicate that Conceptual Clarification was quantitatively higher. This discrepancy reflects the relative positioning in the slope visualization versus the precise values reported in the tabular analysis.
To further explore the overall distribution patterns, a radial plot was utilized. The interpretation-driven cluster exhibited a concentrated structure, with centrality focused predominantly on a few tags. In contrast, the execution-first cluster displayed a more dispersed structure, with centrality distributed more evenly across multiple tags. This comparative visual analysis highlights fundamental differences in cognitive focus and breadth, facilitating clearer identification of structural distinctions between the two reasoning types.
Additionally, a divergence bar chart was utilized to facilitate intuitive comparisons of centrality scores across cognitive tags. By presenting both absolute and relative differences in centrality, this visualization supported a quantitative interpretation of each tag’s structural prominence within the cognitive flow. The visualized scores clearly highlighted the relative significance and distinct functional roles of each tag.
Collectively, these complementary visualization techniques provided a multidimensional perspective on cognitive structure, with each method illuminating different facets of the reasoning process. This integrated analytical system enabled a more nuanced structural interpretation than any single visualization could achieve, uncovering the complex and strategically organized nature of cognitive flows. Moreover, the combined approach demonstrated the feasibility of systematically interpreting large-scale qualitative utterance data in a structured and repeatable manner, underscoring the promise of automated, visualization-driven analysis within qualitative UX research.
4. 3. Structuring and Interpreting Cognitive Flows through Automated Analysis
This study proposed and evaluated an automated procedure for structuring and visualizing qualitative utterance data gathered in UX research. The approach demonstrated strong potential for quantitatively interpreting cognitive flow patterns that are challenging to discern through traditional manual qualitative methods. It allowed for data-driven identification of overarching cognitive structures, including frequently recurring reasoning paths, central roles of specific tags, and the sequential relationships among cognitive functions.
For instance, repetitive loop structures such as Strategic Application → Situational Awareness and chain-like sequences characteristic of the execution-first cognition type—Reflection & Insight → Situational Awareness → Constraint & Limitation—indicate that designers often follow consistent and strategic reasoning patterns. This structural analysis transcends the interpretation of isolated utterances by providing a holistic view of how cognition dynamically unfolds through interrelated flows of utterance units.
Notably, this exploratory effort to automate the processing of qualitative utterances demonstrated the feasibility of quantitatively identifying recurrent tag sequences and their transitional contexts. By applying this method, large volumes of qualitative data can be systematically structured, enabling the data-driven discovery of core cognitive patterns without elusive reliance on analysts’ subjective interpretations.
Unlike traditional approaches that primarily emphasize semantic interpretation, this automated procedure facilitates the systematic construction of overarching reasoning structures and transitional pathways. It complements manual qualitative methods and offers flexible applicability across diverse UX research contexts—not only designer-centered studies but also user-centered investigations—thereby enhancing its practical utility.
In summary, this automated framework for structuring and analyzing cognitive flow advances both the quantification and reproducibility of qualitative UX data. Moreover, it lays a methodological foundation for integrative discussions of qualitative–quantitative convergence, which will be explored in the subsequent chapter.
5. Discussion and Implications
5. 1. Toward a Structured Framework for Integrating Qualitative and Quantitative UX Analysis
The structured qualitative analysis approach proposed in this study opens new methodological avenues for UX research. Traditionally, qualitative and quantitative methods have been applied separately, each serving distinct purposes and employing different techniques. While both approaches offer unique strengths, their respective limitations have seldom been addressed in an integrated way. Qualitative research provides rich contextual insights but often relies heavily on the researcher’s subjective interpretation. Conversely, quantitative research emphasizes objectivity and generalizability but frequently struggles to fully capture nuanced contextual information.
This study aims to address these dichotomous limitations by presenting a concrete methodology that infuses the rigor of quantitative analysis into qualitative data. Through the development of a tagging system combined with visualization-based structural analysis, cognitive flows are transformed into quantifiable data while preserving the contextual richness of the original utterances. This approach serves as a “middle-ground research tool,” effectively merging the interpretive depth of qualitative methods with the systematic precision of quantitative analysis. Here, “middle-ground” denotes an analytical framework that leverages the strengths of both paradigms while remaining practical and accessible to UX practitioners.
Importantly, the analytical system developed in this study requires no advanced technical expertise. Built entirely on open-source tools, such as Pandas, Scikit-learn, and Matplotlib, it empowers UX researchers and designers to independently conduct analyses without dependence on data scientists. This practical foundation facilitates the integration of automation-based qualitative analysis into everyday practice, enhancing both the accessibility and scalability of UX research.
From a practical standpoint, this approach substantially increases analytical efficiency. Processes that once took several weeks can now be completed within hours while simultaneously reducing interpretive inconsistencies among analysts and ensuring greater consistency in results. Visualization techniques—such as Sankey diagrams, slope graphs, and radial plots—enable more intuitively communication of complex cognitive flows, thereby improving stakeholder understanding and supporting informed decision-making.
Ultimately, this study offers a methodological framework that broadens both the scientific rigor and practical relevance of UX research. By enabling comparable results across diverse organizations and projects, it establishes a viable model that contributes to the systemic accumulation and consolidation of UX knowledge.
5. 2. Limitations and Future Directions
While this study presents a novel approach to structuring and automating qualitative data analysis in UX research, several limitations warrant careful consideration to guide interpretation and future application.
First, the accuracy of automation remains an area for improvement. Although the system performed well with structurally clear and straightforward utterances, it faced challenges in accurately interpreting emotional expressions, implicit narratives, and metaphoric language. These difficulties arise from the non-linear and multi-layered nature of human cognition and language use. Consequently, a fully automated approach may not be sufficient; instead, a hybrid model that integrates human judgment with automated tagging is likely a more practical and robust solution. This is particularly relevant for utterances heavily influenced by cultural or organizational contexts, which automated systems alone may struggle to decode comprehensively.
Second, the contextual specificity of the current dataset limits the generalizability of the findings. Since the analysis was conducted using interview data from particular job roles and organizational environments, the applicability of this analytical framework to different contexts—such as other organizations, cultures, or user populations—may be constrained. Cognitive flow structures are shaped by diverse external factors, including organizational culture, project scope, and team dynamics. Therefore, future research should focus on validating and adapting the framework across various settings through broader and more diverse case studies.
Methodologically, the scope of the current analysis is also limited by its reliance on a fixed set of six cognitive flow tags, which may not be universally applicable across all UX research contexts. Domains such as healthcare, education, and B2B solutions might exhibit substantially different cognitive structures, requiring the development of more flexible and context-sensitive tagging schemes tailored to specific fields. Moreover, linguistic and cultural differences present further challenges. Since this study was conducted using Korean-language data, the framework may not be directly transferable to contexts involving other languages or distinct cognitive expression styles. Expanding the framework to multinational teams or multicultural user groups will necessitate adaptations that account for these linguistic and cultural variations.
Lastly, ethical considerations are crucial when applying automated cognitive flow analysis. Although the methodology offers valuable insights into individual reasoning patterns, its misuse—particularly in organizational performance evaluations—could lead to unfair labeling or biased decision-making. Therefore, analysis results should be used strictly as tools to foster shared understanding and cognitive alignment within teams, not as instruments for individual assessment. Establishing clear guidelines for data handling, privacy protection, and responsible use is essential before deploying such analytical systems in practice.
Based on these limitations, we propose three directions for future research. First, further validation through repeated experiments across diverse organizational and cultural contexts is needed to confirm the reliability and applicability of the analytical framework. Longitudinal studies comparing cognitive patterns across domains, cultures, and organizations would strengthen its generalizability.
Second, domain-specific tagging systems and transition structures should be developed and extended into adaptable frameworks. Such advancements would support real-world applications in areas such as collaborative design projects, medical UX, and public services.
Third, the analytical framework should be developed into a deployable tool that automates the entire process—from data collection through analysis, visualization, and report generation. Doing so would establish a repeatable and efficient system, thereby increasing the accessibility and effectiveness of UX research.
6. Conclusion
This study introduced a novel analytical framework for the structured and visual analysis of cognitive flows based on qualitative interview data. By integrating qualitative insights with quantitative rigor, the approach enables a data-driven interpretation of designers’ cognitive progression within UX research. The results demonstrated that recurring cognitive patterns, central tags, and transition structures can be systematically and quantitatively identified.
The methodology leveraged multiple complementary visualization techniques—such as Sankey diagrams, heatmaps, and slope graphs—to facilitate multilayered interpretations of cognitive flows. This visualization-driven analysis breaks from traditional manual qualitative methods by capturing the temporal and structural dimensions of reasoning processes. By enabling the construction of complex cognitive structures through repeatable and automated procedures, this framework advances the quantification and automation of UX research, thereby contributing to enhanced analytical rigor and practical applicability.
Moreover, this analytical framework is highly practical and scalable, relying solely on Python-based open-source tools without requiring advanced AI technologies or proprietary software. Regardless of a researcher’s technical skill level, the method can be repeatedly applied as a practice-oriented tool in qualitative UX research. It also holds promise for standardizing UX research methodologies and is adaptable for both user-centered and designer-centered inquiries.
Ultimately, this study contributes to the advancement of UX research by proposing a practice-driven approach that structures and automates the analysis of cognitive flows. By expressing designer cognition in quantitative terms, it expands the possibilities of data-driven analysis in UX and lays the groundwork for future integrative research bridging qualitative and quantitative paradigms.
Acknowledgments
This study was supported by the National Research Foundation of Korea (NRF) grant funded by the Korean government (Ministry of Education) (NRF-2023S1A5A2A03084950).
Notes
Copyright : This is an Open Access article distributed under the terms of the Creative Commons Attribution Non-Commercial License (http://creativecommons.org/licenses/by-nc/3.0/), which permits unrestricted educational and non-commercial use, provided the original work is properly cited.
References
- Berg, B. L. (2007). Qualitative research methods for the social sciences (6th ed.). Pearson Education.
-
Braun, V., & Clarke, V. (2006). Using thematic analysis in psychology. Qualitative Research in Psychology, 3(2), 77-101.
[https://doi.org/10.1191/1478088706qp063oa]

-
Ericsson, K. A., & Simon, H. A. (1993). Protocol analysis: Verbal reports as data (Rev. ed.). MIT Press.
[https://doi.org/10.7551/mitpress/5657.001.0001]
-
Glaser, B. G., & Strauss, A. L. (1967). The discovery of grounded theory: Strategies for qualitative research. Aldine.
[https://doi.org/10.1097/00006199-196807000-00014]
- Glaser, B. G., & Strauss, A. L. (1999). The discovery of grounded theory: Strategies for qualitative research. Aldine Transaction.
-
Hamza, K. M. (2014). Disciplinary boundaries: A case study of constructing a relationship between the human body and electricity. Cultural Studies of Science Education, 9(2), 407-421.
[https://doi.org/10.1007/s11422-013-9516-z]
- Hanington, B., & Martin, B. (2012). Universal methods of design: 100 ways to research complex problems, develop innovative ideas, and design effective solutions. Rockport Publishers.
- Kvale, S. (1996). InterViews: An introduction to qualitative research interviewing. Sage Publications.
-
Min, J., & Lee, H. (2023). An analysis of user responses in the early stage of design thinking: A topic modeling approach based on YouTube comments. Korea Design Forum, 45, 43-54.
[https://doi.org/10.21326/kdf.2023.45.043]
- Nielsen Norman Group. (2017). User interviews. https://www.nngroup.com/articles/user-interviews/.
-
Park, J. (2020). Exploring branding strategies of global design companies through SNS big data analysis. Journal of Digital Design Convergence, 19(2), 55-67.
[https://doi.org/10.37279/jdr.2020.19.2.55]
-
Petukhova, A., Matos-Carvalho, J. P., & Fachada, N. (2024). Comparing embedding models and clustering methods for topic modeling on scientific and news text corpora. Information Processing & Management, 61(1), 103328.
[https://doi.org/10.1016/j.ipm.2023.103328]
-
Thomas, D. R. (2006). A general inductive approach for analyzing qualitative evaluation data. American Journal of Evaluation, 27(2), 237-246.
[https://doi.org/10.1177/1098214005283748]
-
Xiong, Z., Yan, Z., Yao, H., & Liang, S. (2020). Data-driven product design using user reviews via clustering and topic modeling. Design Studies, 68 , 122-149.
[https://doi.org/10.1016/j.destud.2020.02.001]
-
Yoon, S., Kim, J., & Chung, D. (2022). A big data-based text mining study for analyzing the metaverse industry ecosystem. Journal of Digital Design, 22(1), 103-114.
[https://doi.org/10.17280/jdd.2022.22.1.103]
-
Henriksen, E. S., Følstad, A., & Boletsis, K. (2025). Exploring users' privacy decision making in retail: Insights and challenges for HCI research. Quality and User Experience, 10(4).
[https://doi.org/10.1007/s41233-025-00074-5]
-
Jiang, J. A., Wang, R., Zhang, X., & Toyama, K. (2021). Supporting serendipity: Opportunities and challenges in qualitative data analysis. Proceedings of the ACM on Human-Computer Interaction, 5(CSCW2), 1-27.
[https://doi.org/10.1145/3476081]
-
Parfenova, A. (2024). Automating the information extraction from semi-structured interview transcripts. arXiv preprint arXiv:2403.04819. https://arxiv.org/abs/2403.04819.
[https://doi.org/10.1145/3589335.3651230]
-
Rutledge, P. B., & Hogg, J. L. C. (2023). In-depth interviews. In J. D. Hogg (Ed.), International encyclopedia of media psychology (pp. 1-6). Wiley. https://www.researchgate.net/publication/345737833_In-Depth_Interviews.
[https://doi.org/10.1002/9781119011071.iemp0019]
-
McCarthy, J., & Wright, P. C. (2004). Technology as Experience. MIT Press. https://www.researchgate.net/publication/224927635_Technology_as_Experience.
[https://doi.org/10.7551/mitpress/6687.001.0001]